| Output Created | 06-SEP-2003 00:45:46 | |
|---|---|---|
| Comments | ||
| Input | Data | E:\Brain030905\SOMFinal\results\results05Sep_2238_50kits.dat |
| Filter | <none> | |
| Weight | <none> | |
| Split File | <none> | |
| N of Rows in Working Data File | 160 | |
| Missing Value Handling | Definition of Missing | User defined missing values are treated as missing. |
| Cases Used | Statistics for each analysis are based on the cases with no missing or out-of-range data for any variable in the analysis. | |
| Syntax | T-TEST GROUPS=var00001(1 2) /MISSING=ANALYSIS /VARIABLES=abs /CRITERIA=CIN(.95) . |
|
| Resources | Elapsed Time | 0:00:00,05 |
| VAR00001 | N | Mean | Std. Deviation | Std. Error Mean | |
|---|---|---|---|---|---|
| ABS | 1,00 | 20 | 27.6748 | 35.81945 | 8.00947 |
| 2,00 | 20 | 25.6604 | 81.34636 | 18.18960 |
| Levene's Test for Equality of Variances | t-test for Equality of Means | |||||||||
|---|---|---|---|---|---|---|---|---|---|---|
| F | Sig. | t | df | Sig. (2-tailed) | Mean Difference | Std. Error Difference | 95% Confidence Interval of the Difference | |||
| Lower | Upper | |||||||||
| ABS | Equal variances assumed | ,445 | ,509 | ,101 | 38 | ,920 | 2.0144 | 19.87494 | -38.22031 | 42.24911 |
| Equal variances not assumed | ,101 | 26,101 | ,920 | 2.0144 | 19.87494 | -38.83143 | 42.86023 | |||
| Output Created | 06-SEP-2003 00:49:52 | |
|---|---|---|
| Comments | ||
| Input | Data | E:\Brain030905\SOMFinal\results\results05Sep_2238_50kits.dat |
| Filter | <none> | |
| Weight | <none> | |
| Split File | <none> | |
| N of Rows in Working Data File | 160 | |
| Missing Value Handling | Definition of Missing | User defined missing values are treated as missing. |
| Cases Used | Statistics for each analysis are based on the cases with no missing or out-of-range data for any variable in the analysis. | |
| Syntax | T-TEST GROUPS=var00001(1 3) /MISSING=ANALYSIS /VARIABLES=abs /CRITERIA=CIN(.95) . |
|
| Resources | Elapsed Time | 0:00:00,10 |
| VAR00001 | N | Mean | Std. Deviation | Std. Error Mean | |
|---|---|---|---|---|---|
| ABS | 1,00 | 20 | 27.6748 | 35.81945 | 8.00947 |
| 3,00 | 20 | 50.9563 | 94.11363 | 21.04445 |
| Levene's Test for Equality of Variances | t-test for Equality of Means | |||||||||
|---|---|---|---|---|---|---|---|---|---|---|
| F | Sig. | t | df | Sig. (2-tailed) | Mean Difference | Std. Error Difference | 95% Confidence Interval of the Difference | |||
| Lower | Upper | |||||||||
| ABS | Equal variances assumed | 3,250 | ,079 | -1,034 | 38 | ,308 | -23.2815 | 22.51711 | -68.86497 | 22.30206 |
| Equal variances not assumed | -1,034 | 24,391 | ,311 | -23.2815 | 22.51711 | -69.71507 | 23.15216 | |||
| Output Created | 06-SEP-2003 00:50:46 | |
|---|---|---|
| Comments | ||
| Input | Data | E:\Brain030905\SOMFinal\results\results05Sep_2238_50kits.dat |
| Filter | <none> | |
| Weight | <none> | |
| Split File | <none> | |
| N of Rows in Working Data File | 160 | |
| Missing Value Handling | Definition of Missing | User defined missing values are treated as missing. |
| Cases Used | Statistics for each analysis are based on the cases with no missing or out-of-range data for any variable in the analysis. | |
| Syntax | T-TEST GROUPS=var00001(1 4) /MISSING=ANALYSIS /VARIABLES=abs /CRITERIA=CIN(.95) . |
|
| Resources | Elapsed Time | 0:00:00,09 |
| VAR00001 | N | Mean | Std. Deviation | Std. Error Mean | |
|---|---|---|---|---|---|
| ABS | 1,00 | 20 | 27.6748 | 35.81945 | 8.00947 |
| 4,00 | 20 | 204.6244 | 327.56632 | 73.24606 |
| Levene's Test for Equality of Variances | t-test for Equality of Means | |||||||||
|---|---|---|---|---|---|---|---|---|---|---|
| F | Sig. | t | df | Sig. (2-tailed) | Mean Difference | Std. Error Difference | 95% Confidence Interval of the Difference | |||
| Lower | Upper | |||||||||
| ABS | Equal variances assumed | 31,797 | ,000 | -2,402 | 38 | ,021 | -176.9496 | 73.68267 | -326.11237 | -27.78682 |
| Equal variances not assumed | -2,402 | 19,454 | ,026 | -176.9496 | 73.68267 | -330.92580 | -22.97339 | |||
| Output Created | 06-SEP-2003 00:52:22 | |
|---|---|---|
| Comments | ||
| Input | Data | E:\Brain030905\SOMFinal\results\results05Sep_2238_50kits.dat |
| Filter | <none> | |
| Weight | <none> | |
| Split File | <none> | |
| N of Rows in Working Data File | 160 | |
| Missing Value Handling | Definition of Missing | User defined missing values are treated as missing. |
| Cases Used | Statistics for each analysis are based on the cases with no missing or out-of-range data for any variable in the analysis. | |
| Syntax | T-TEST GROUPS=var00001(1 7) /MISSING=ANALYSIS /VARIABLES=abs /CRITERIA=CIN(.95) . |
|
| Resources | Elapsed Time | 0:00:00,09 |
| VAR00001 | N | Mean | Std. Deviation | Std. Error Mean | |
|---|---|---|---|---|---|
| ABS | 1,00 | 20 | 27.6748 | 35.81945 | 8.00947 |
| 7,00 | 20 | 83.1599 | 77.02621 | 17.22358 |
| Levene's Test for Equality of Variances | t-test for Equality of Means | |||||||||
|---|---|---|---|---|---|---|---|---|---|---|
| F | Sig. | t | df | Sig. (2-tailed) | Mean Difference | Std. Error Difference | 95% Confidence Interval of the Difference | |||
| Lower | Upper | |||||||||
| ABS | Equal variances assumed | 11,478 | ,002 | -2,921 | 38 | ,006 | -55.4850 | 18.99483 | -93.93805 | -17.03202 |
| Equal variances not assumed | -2,921 | 26,850 | ,007 | -55.4850 | 18.99483 | -94.46936 | -16.50071 | |||
| Output Created | 06-SEP-2003 00:55:54 | |
|---|---|---|
| Comments | ||
| Input | Data | E:\Brain030905\SOMFinal\results\results05Sep_2238_50kits.sav |
| Filter | <none> | |
| Weight | <none> | |
| Split File | <none> | |
| N of Rows in Working Data File | 160 | |
| Missing Value Handling | Definition of Missing | User-defined missing values are treated as missing. |
| Cases Used | Statistics for each analysis are based on cases with no missing data for any variable in the analysis. | |
| Syntax | ONEWAY abs BY var00001 /STATISTICS DESCRIPTIVES /MISSING ANALYSIS /POSTHOC = SNK BTUKEY BONFERRONI ALPHA(.05). |
|
| Resources | Elapsed Time | 0:00:00,22 |
| N | Mean | Std. Deviation | Std. Error | 95% Confidence Interval for Mean | Minimum | Maximum | ||
|---|---|---|---|---|---|---|---|---|
| Lower Bound | Upper Bound | |||||||
| 1,00 | 20 | 27.6748 | 35.81945 | 8.00947 | 10.9108 | 44.4388 | 1.10 | 146.76 |
| 2,00 | 20 | 25.6604 | 81.34636 | 18.18960 | -12.4108 | 63.7317 | .02 | 369.61 |
| 3,00 | 20 | 50.9563 | 94.11363 | 21.04445 | 6.9097 | 95.0028 | .26 | 412.63 |
| 4,00 | 20 | 204.6244 | 327.56632 | 73.24606 | 51.3187 | 357.9302 | 1.21 | 925.37 |
| 5,00 | 20 | 34.0915 | 34.19991 | 7.64733 | 18.0855 | 50.0976 | 1.29 | 127.09 |
| 6,00 | 20 | 21.9115 | 20.08858 | 4.49194 | 12.5098 | 31.3133 | 1.52 | 85.64 |
| 7,00 | 20 | 83.1599 | 77.02621 | 17.22358 | 47.1105 | 119.2092 | .12 | 259.95 |
| 8,00 | 20 | 100.6280 | 58.27267 | 13.03017 | 73.3555 | 127.9004 | 8.96 | 186.48 |
| Total | 160 | 68.5884 | 139.69974 | 11.04423 | 46.7760 | 90.4007 | .02 | 925.37 |
| Sum of Squares | df | Mean Square | F | Sig. | |
|---|---|---|---|---|---|
| Between Groups | 538820,935 | 7 | 76974,419 | 4,563 | ,000 |
| Within Groups | 2564225,874 | 152 | 16869,907 | ||
| Total | 3103046,809 | 159 |
| Mean Difference (I-J) | Std. Error | Sig. | 95% Confidence Interval | ||||
|---|---|---|---|---|---|---|---|
| (I) VAR00001 | (J) VAR00001 | Lower Bound | Upper Bound | ||||
| Bonferroni | 1,00 | 2,00 | 2.0144 | 41.07299 | 1,000 | -128.5940 | 132.6228 |
| 3,00 | -23.2815 | 41.07299 | 1,000 | -153.8899 | 107.3270 | ||
| 4,00 | -176.9496(*) | 41.07299 | ,001 | -307.5580 | -46.3412 | ||
| 5,00 | -6.4167 | 41.07299 | 1,000 | -137.0251 | 124.1918 | ||
| 6,00 | 5.7633 | 41.07299 | 1,000 | -124.8452 | 136.3717 | ||
| 7,00 | -55.4850 | 41.07299 | 1,000 | -186.0935 | 75.1234 | ||
| 8,00 | -72.9531 | 41.07299 | 1,000 | -203.5616 | 57.6553 | ||
| 2,00 | 1,00 | -2.0144 | 41.07299 | 1,000 | -132.6228 | 128.5940 | |
| 3,00 | -25.2959 | 41.07299 | 1,000 | -155.9043 | 105.3126 | ||
| 4,00 | -178.9640(*) | 41.07299 | ,001 | -309.5724 | -48.3556 | ||
| 5,00 | -8.4311 | 41.07299 | 1,000 | -139.0395 | 122.1774 | ||
| 6,00 | 3.7489 | 41.07299 | 1,000 | -126.8596 | 134.3573 | ||
| 7,00 | -57.4994 | 41.07299 | 1,000 | -188.1079 | 73.1090 | ||
| 8,00 | -74.9675 | 41.07299 | 1,000 | -205.5760 | 55.6409 | ||
| 3,00 | 1,00 | 23.2815 | 41.07299 | 1,000 | -107.3270 | 153.8899 | |
| 2,00 | 25.2959 | 41.07299 | 1,000 | -105.3126 | 155.9043 | ||
| 4,00 | -153.6681(*) | 41.07299 | ,007 | -284.2766 | -23.0597 | ||
| 5,00 | 16.8648 | 41.07299 | 1,000 | -113.7437 | 147.4732 | ||
| 6,00 | 29.0447 | 41.07299 | 1,000 | -101.5637 | 159.6532 | ||
| 7,00 | -32.2036 | 41.07299 | 1,000 | -162.8120 | 98.4049 | ||
| 8,00 | -49.6717 | 41.07299 | 1,000 | -180.2801 | 80.9368 | ||
| 4,00 | 1,00 | 176.9496(*) | 41.07299 | ,001 | 46.3412 | 307.5580 | |
| 2,00 | 178.9640(*) | 41.07299 | ,001 | 48.3556 | 309.5724 | ||
| 3,00 | 153.6681(*) | 41.07299 | ,007 | 23.0597 | 284.2766 | ||
| 5,00 | 170.5329(*) | 41.07299 | ,002 | 39.9245 | 301.1413 | ||
| 6,00 | 182.7129(*) | 41.07299 | ,000 | 52.1044 | 313.3213 | ||
| 7,00 | 121.4646 | 41.07299 | ,101 | -9.1439 | 252.0730 | ||
| 8,00 | 103.9964 | 41.07299 | ,346 | -26.6120 | 234.6049 | ||
| 5,00 | 1,00 | 6.4167 | 41.07299 | 1,000 | -124.1918 | 137.0251 | |
| 2,00 | 8.4311 | 41.07299 | 1,000 | -122.1774 | 139.0395 | ||
| 3,00 | -16.8648 | 41.07299 | 1,000 | -147.4732 | 113.7437 | ||
| 4,00 | -170.5329(*) | 41.07299 | ,002 | -301.1413 | -39.9245 | ||
| 6,00 | 12.1800 | 41.07299 | 1,000 | -118.4285 | 142.7884 | ||
| 7,00 | -49.0683 | 41.07299 | 1,000 | -179.6768 | 81.5401 | ||
| 8,00 | -66.5365 | 41.07299 | 1,000 | -197.1449 | 64.0720 | ||
| 6,00 | 1,00 | -5.7633 | 41.07299 | 1,000 | -136.3717 | 124.8452 | |
| 2,00 | -3.7489 | 41.07299 | 1,000 | -134.3573 | 126.8596 | ||
| 3,00 | -29.0447 | 41.07299 | 1,000 | -159.6532 | 101.5637 | ||
| 4,00 | -182.7129(*) | 41.07299 | ,000 | -313.3213 | -52.1044 | ||
| 5,00 | -12.1800 | 41.07299 | 1,000 | -142.7884 | 118.4285 | ||
| 7,00 | -61.2483 | 41.07299 | 1,000 | -191.8568 | 69.3601 | ||
| 8,00 | -78.7164 | 41.07299 | 1,000 | -209.3249 | 51.8920 | ||
| 7,00 | 1,00 | 55.4850 | 41.07299 | 1,000 | -75.1234 | 186.0935 | |
| 2,00 | 57.4994 | 41.07299 | 1,000 | -73.1090 | 188.1079 | ||
| 3,00 | 32.2036 | 41.07299 | 1,000 | -98.4049 | 162.8120 | ||
| 4,00 | -121.4646 | 41.07299 | ,101 | -252.0730 | 9.1439 | ||
| 5,00 | 49.0683 | 41.07299 | 1,000 | -81.5401 | 179.6768 | ||
| 6,00 | 61.2483 | 41.07299 | 1,000 | -69.3601 | 191.8568 | ||
| 8,00 | -17.4681 | 41.07299 | 1,000 | -148.0765 | 113.1403 | ||
| 8,00 | 1,00 | 72.9531 | 41.07299 | 1,000 | -57.6553 | 203.5616 | |
| 2,00 | 74.9675 | 41.07299 | 1,000 | -55.6409 | 205.5760 | ||
| 3,00 | 49.6717 | 41.07299 | 1,000 | -80.9368 | 180.2801 | ||
| 4,00 | -103.9964 | 41.07299 | ,346 | -234.6049 | 26.6120 | ||
| 5,00 | 66.5365 | 41.07299 | 1,000 | -64.0720 | 197.1449 | ||
| 6,00 | 78.7164 | 41.07299 | 1,000 | -51.8920 | 209.3249 | ||
| 7,00 | 17.4681 | 41.07299 | 1,000 | -113.1403 | 148.0765 | ||
| * The mean difference is significant at the .05 level. | |||||||
| N | Subset for alpha = .05 | |||
|---|---|---|---|---|
| VAR00001 | 1 | 2 | ||
| Student-Newman-Keuls(a) | 6,00 | 20 | 21.9115 | |
| 2,00 | 20 | 25.6604 | ||
| 1,00 | 20 | 27.6748 | ||
| 5,00 | 20 | 34.0915 | ||
| 3,00 | 20 | 50.9563 | ||
| 7,00 | 20 | 83.1599 | ||
| 8,00 | 20 | 100.6280 | ||
| 4,00 | 20 | 204.6244 | ||
| Sig. | ,473 | 1,000 | ||
| Tukey B(a) | 6,00 | 20 | 21.9115 | |
| 2,00 | 20 | 25.6604 | ||
| 1,00 | 20 | 27.6748 | ||
| 5,00 | 20 | 34.0915 | ||
| 3,00 | 20 | 50.9563 | ||
| 7,00 | 20 | 83.1599 | ||
| 8,00 | 20 | 100.6280 | ||
| 4,00 | 20 | 204.6244 | ||
| Means for groups in homogeneous subsets are displayed. | ||||
| a Uses Harmonic Mean Sample Size = 20,000. | ||||
  1-20  NFS 1   Non-rivaling   Familiar    Simple
 21-40  NUS 2   "              Unfamiliar  "
 41-60  RFS 3   Rivaling       Familiar    "
 61-80  RUS 4   "              Unfamiliar  "
 81-100 NFC 5   Non-rivaling   Familiar    Complex
101-120 NUC 6   "              Unfamiliar  "
121-140 RFC 7   Rivaling       Familiar    "
141-160 RUC 8   "              Unfamiliar  "
| Output Created | 06-SEP-2003 16:03:53 | |
|---|---|---|
| Comments | ||
| Input | Data | E:\Brain030905\SOMFinal\results\results06Sep_1600.dat |
| Filter | <none> | |
| Weight | <none> | |
| Split File | <none> | |
| N of Rows in Working Data File | 160 | |
| Missing Value Handling | Definition of Missing | User-defined missing values are treated as missing. |
| Cases Used | Statistics for each analysis are based on cases with no missing data for any variable in the analysis. | |
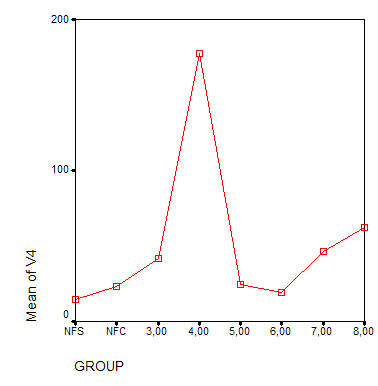
| Syntax | ONEWAY v4 BY group /STATISTICS DESCRIPTIVES /PLOT MEANS /MISSING ANALYSIS /POSTHOC = SNK BTUKEY LSD SIDAK ALPHA(.05). |
|
| Resources | Elapsed Time | 0:00:01,05 |
| N | Mean | Std. Deviation | Std. Error | 95% Confidence Interval for Mean | Minimum | Maximum | ||
|---|---|---|---|---|---|---|---|---|
| Lower Bound | Upper Bound | |||||||
| NFS | 20 | 14.53446855 | 13.886235228 | 3.105056592 | 8.03551041 | 21.03342669 | .542847 | 45.320500 |
| NFC | 20 | 22.91778145 | 76.000995442 | 16.994339217 | -12.65177932 | 58.48734222 | .799186 | 343.824000 |
| 3,00 | 20 | 41.93995700 | 55.762103317 | 12.468785359 | 15.84248932 | 68.03742468 | 1.669900 | 228.936000 |
| 4,00 | 20 | 177.47368400 | 304.082669464 | 67.994951970 | 35.15861395 | 319.78875405 | 2.028570 | 875.749000 |
| 5,00 | 20 | 24.26544255 | 15.267767181 | 3.413976528 | 17.11990756 | 31.41097754 | .128221 | 60.369400 |
| 6,00 | 20 | 19.15635145 | 31.608593488 | 7.067896371 | 4.36307433 | 33.94962857 | .263359 | 141.906000 |
| 7,00 | 20 | 46.64566750 | 34.680590578 | 7.754815803 | 30.41465149 | 62.87668351 | 1.211240 | 127.701000 |
| 8,00 | 20 | 62.22530850 | 29.385192134 | 6.570728714 | 48.47261525 | 75.97800175 | 2.374670 | 106.585000 |
| Total | 160 | 51.14483263 | 122.690244592 | 9.699515490 | 31.98832627 | 70.30133898 | .128221 | 875.749000 |
| Sum of Squares | df | Mean Square | F | Sig. | |
|---|---|---|---|---|---|
| Between Groups | 401391,551 | 7 | 57341,650 | 4,375 | ,000 |
| Within Groups | 1992018,931 | 152 | 13105,388 | ||
| Total | 2393410,483 | 159 |
| Mean Difference (I-J) | Std. Error | Sig. | 95% Confidence Interval | ||||
|---|---|---|---|---|---|---|---|
| (I) GROUP | (J) GROUP | Lower Bound | Upper Bound | ||||
| LSD | NFS | NFC | -8.38331290 | 36.201364209 | ,817 | -79.90612835 | 63.13950255 |
| 3,00 | -27.40548845 | 36.201364209 | ,450 | -98.92830390 | 44.11732700 | ||
| 4,00 | -162.93921545(*) | 36.201364209 | ,000 | -234.46203090 | -91.41640000 | ||
| 5,00 | -9.73097400 | 36.201364209 | ,788 | -81.25378945 | 61.79184145 | ||
| 6,00 | -4.62188290 | 36.201364209 | ,899 | -76.14469835 | 66.90093255 | ||
| 7,00 | -32.11119895 | 36.201364209 | ,376 | -103.63401440 | 39.41161650 | ||
| 8,00 | -47.69083995 | 36.201364209 | ,190 | -119.21365540 | 23.83197550 | ||
| NFC | NFS | 8.38331290 | 36.201364209 | ,817 | -63.13950255 | 79.90612835 | |
| 3,00 | -19.02217555 | 36.201364209 | ,600 | -90.54499100 | 52.50063990 | ||
| 4,00 | -154.55590255(*) | 36.201364209 | ,000 | -226.07871800 | -83.03308710 | ||
| 5,00 | -1.34766110 | 36.201364209 | ,970 | -72.87047655 | 70.17515435 | ||
| 6,00 | 3.76143000 | 36.201364209 | ,917 | -67.76138545 | 75.28424545 | ||
| 7,00 | -23.72788605 | 36.201364209 | ,513 | -95.25070150 | 47.79492940 | ||
| 8,00 | -39.30752705 | 36.201364209 | ,279 | -110.83034250 | 32.21528840 | ||
| 3,00 | NFS | 27.40548845 | 36.201364209 | ,450 | -44.11732700 | 98.92830390 | |
| NFC | 19.02217555 | 36.201364209 | ,600 | -52.50063990 | 90.54499100 | ||
| 4,00 | -135.53372700(*) | 36.201364209 | ,000 | -207.05654245 | -64.01091155 | ||
| 5,00 | 17.67451445 | 36.201364209 | ,626 | -53.84830100 | 89.19732990 | ||
| 6,00 | 22.78360555 | 36.201364209 | ,530 | -48.73920990 | 94.30642100 | ||
| 7,00 | -4.70571050 | 36.201364209 | ,897 | -76.22852595 | 66.81710495 | ||
| 8,00 | -20.28535150 | 36.201364209 | ,576 | -91.80816695 | 51.23746395 | ||
| 4,00 | NFS | 162.93921545(*) | 36.201364209 | ,000 | 91.41640000 | 234.46203090 | |
| NFC | 154.55590255(*) | 36.201364209 | ,000 | 83.03308710 | 226.07871800 | ||
| 3,00 | 135.53372700(*) | 36.201364209 | ,000 | 64.01091155 | 207.05654245 | ||
| 5,00 | 153.20824145(*) | 36.201364209 | ,000 | 81.68542600 | 224.73105690 | ||
| 6,00 | 158.31733255(*) | 36.201364209 | ,000 | 86.79451710 | 229.84014800 | ||
| 7,00 | 130.82801650(*) | 36.201364209 | ,000 | 59.30520105 | 202.35083195 | ||
| 8,00 | 115.24837550(*) | 36.201364209 | ,002 | 43.72556005 | 186.77119095 | ||
| 5,00 | NFS | 9.73097400 | 36.201364209 | ,788 | -61.79184145 | 81.25378945 | |
| NFC | 1.34766110 | 36.201364209 | ,970 | -70.17515435 | 72.87047655 | ||
| 3,00 | -17.67451445 | 36.201364209 | ,626 | -89.19732990 | 53.84830100 | ||
| 4,00 | -153.20824145(*) | 36.201364209 | ,000 | -224.73105690 | -81.68542600 | ||
| 6,00 | 5.10909110 | 36.201364209 | ,888 | -66.41372435 | 76.63190655 | ||
| 7,00 | -22.38022495 | 36.201364209 | ,537 | -93.90304040 | 49.14259050 | ||
| 8,00 | -37.95986595 | 36.201364209 | ,296 | -109.48268140 | 33.56294950 | ||
| 6,00 | NFS | 4.62188290 | 36.201364209 | ,899 | -66.90093255 | 76.14469835 | |
| NFC | -3.76143000 | 36.201364209 | ,917 | -75.28424545 | 67.76138545 | ||
| 3,00 | -22.78360555 | 36.201364209 | ,530 | -94.30642100 | 48.73920990 | ||
| 4,00 | -158.31733255(*) | 36.201364209 | ,000 | -229.84014800 | -86.79451710 | ||
| 5,00 | -5.10909110 | 36.201364209 | ,888 | -76.63190655 | 66.41372435 | ||
| 7,00 | -27.48931605 | 36.201364209 | ,449 | -99.01213150 | 44.03349940 | ||
| 8,00 | -43.06895705 | 36.201364209 | ,236 | -114.59177250 | 28.45385840 | ||
| 7,00 | NFS | 32.11119895 | 36.201364209 | ,376 | -39.41161650 | 103.63401440 | |
| NFC | 23.72788605 | 36.201364209 | ,513 | -47.79492940 | 95.25070150 | ||
| 3,00 | 4.70571050 | 36.201364209 | ,897 | -66.81710495 | 76.22852595 | ||
| 4,00 | -130.82801650(*) | 36.201364209 | ,000 | -202.35083195 | -59.30520105 | ||
| 5,00 | 22.38022495 | 36.201364209 | ,537 | -49.14259050 | 93.90304040 | ||
| 6,00 | 27.48931605 | 36.201364209 | ,449 | -44.03349940 | 99.01213150 | ||
| 8,00 | -15.57964100 | 36.201364209 | ,668 | -87.10245645 | 55.94317445 | ||
| 8,00 | NFS | 47.69083995 | 36.201364209 | ,190 | -23.83197550 | 119.21365540 | |
| NFC | 39.30752705 | 36.201364209 | ,279 | -32.21528840 | 110.83034250 | ||
| 3,00 | 20.28535150 | 36.201364209 | ,576 | -51.23746395 | 91.80816695 | ||
| 4,00 | -115.24837550(*) | 36.201364209 | ,002 | -186.77119095 | -43.72556005 | ||
| 5,00 | 37.95986595 | 36.201364209 | ,296 | -33.56294950 | 109.48268140 | ||
| 6,00 | 43.06895705 | 36.201364209 | ,236 | -28.45385840 | 114.59177250 | ||
| 7,00 | 15.57964100 | 36.201364209 | ,668 | -55.94317445 | 87.10245645 | ||
| Sidak | NFS | NFC | -8.38331290 | 36.201364209 | 1,000 | -123.22448186 | 106.45785606 |
| 3,00 | -27.40548845 | 36.201364209 | 1,000 | -142.24665741 | 87.43568051 | ||
| 4,00 | -162.93921545(*) | 36.201364209 | ,000 | -277.78038441 | -48.09804649 | ||
| 5,00 | -9.73097400 | 36.201364209 | 1,000 | -124.57214296 | 105.11019496 | ||
| 6,00 | -4.62188290 | 36.201364209 | 1,000 | -119.46305186 | 110.21928606 | ||
| 7,00 | -32.11119895 | 36.201364209 | 1,000 | -146.95236791 | 82.72997001 | ||
| 8,00 | -47.69083995 | 36.201364209 | ,997 | -162.53200891 | 67.15032901 | ||
| NFC | NFS | 8.38331290 | 36.201364209 | 1,000 | -106.45785606 | 123.22448186 | |
| 3,00 | -19.02217555 | 36.201364209 | 1,000 | -133.86334451 | 95.81899341 | ||
| 4,00 | -154.55590255(*) | 36.201364209 | ,001 | -269.39707151 | -39.71473359 | ||
| 5,00 | -1.34766110 | 36.201364209 | 1,000 | -116.18883006 | 113.49350786 | ||
| 6,00 | 3.76143000 | 36.201364209 | 1,000 | -111.07973896 | 118.60259896 | ||
| 7,00 | -23.72788605 | 36.201364209 | 1,000 | -138.56905501 | 91.11328291 | ||
| 8,00 | -39.30752705 | 36.201364209 | 1,000 | -154.14869601 | 75.53364191 | ||
| 3,00 | NFS | 27.40548845 | 36.201364209 | 1,000 | -87.43568051 | 142.24665741 | |
| NFC | 19.02217555 | 36.201364209 | 1,000 | -95.81899341 | 133.86334451 | ||
| 4,00 | -135.53372700(*) | 36.201364209 | ,007 | -250.37489596 | -20.69255804 | ||
| 5,00 | 17.67451445 | 36.201364209 | 1,000 | -97.16665451 | 132.51568341 | ||
| 6,00 | 22.78360555 | 36.201364209 | 1,000 | -92.05756341 | 137.62477451 | ||
| 7,00 | -4.70571050 | 36.201364209 | 1,000 | -119.54687946 | 110.13545846 | ||
| 8,00 | -20.28535150 | 36.201364209 | 1,000 | -135.12652046 | 94.55581746 | ||
| 4,00 | NFS | 162.93921545(*) | 36.201364209 | ,000 | 48.09804649 | 277.78038441 | |
| NFC | 154.55590255(*) | 36.201364209 | ,001 | 39.71473359 | 269.39707151 | ||
| 3,00 | 135.53372700(*) | 36.201364209 | ,007 | 20.69255804 | 250.37489596 | ||
| 5,00 | 153.20824145(*) | 36.201364209 | ,001 | 38.36707249 | 268.04941041 | ||
| 6,00 | 158.31733255(*) | 36.201364209 | ,001 | 43.47616359 | 273.15850151 | ||
| 7,00 | 130.82801650(*) | 36.201364209 | ,011 | 15.98684754 | 245.66918546 | ||
| 8,00 | 115.24837550(*) | 36.201364209 | ,048 | .40720654 | 230.08954446 | ||
| 5,00 | NFS | 9.73097400 | 36.201364209 | 1,000 | -105.11019496 | 124.57214296 | |
| NFC | 1.34766110 | 36.201364209 | 1,000 | -113.49350786 | 116.18883006 | ||
| 3,00 | -17.67451445 | 36.201364209 | 1,000 | -132.51568341 | 97.16665451 | ||
| 4,00 | -153.20824145(*) | 36.201364209 | ,001 | -268.04941041 | -38.36707249 | ||
| 6,00 | 5.10909110 | 36.201364209 | 1,000 | -109.73207786 | 119.95026006 | ||
| 7,00 | -22.38022495 | 36.201364209 | 1,000 | -137.22139391 | 92.46094401 | ||
| 8,00 | -37.95986595 | 36.201364209 | 1,000 | -152.80103491 | 76.88130301 | ||
| 6,00 | NFS | 4.62188290 | 36.201364209 | 1,000 | -110.21928606 | 119.46305186 | |
| NFC | -3.76143000 | 36.201364209 | 1,000 | -118.60259896 | 111.07973896 | ||
| 3,00 | -22.78360555 | 36.201364209 | 1,000 | -137.62477451 | 92.05756341 | ||
| 4,00 | -158.31733255(*) | 36.201364209 | ,001 | -273.15850151 | -43.47616359 | ||
| 5,00 | -5.10909110 | 36.201364209 | 1,000 | -119.95026006 | 109.73207786 | ||
| 7,00 | -27.48931605 | 36.201364209 | 1,000 | -142.33048501 | 87.35185291 | ||
| 8,00 | -43.06895705 | 36.201364209 | ,999 | -157.91012601 | 71.77221191 | ||
| 7,00 | NFS | 32.11119895 | 36.201364209 | 1,000 | -82.72997001 | 146.95236791 | |
| NFC | 23.72788605 | 36.201364209 | 1,000 | -91.11328291 | 138.56905501 | ||
| 3,00 | 4.70571050 | 36.201364209 | 1,000 | -110.13545846 | 119.54687946 | ||
| 4,00 | -130.82801650(*) | 36.201364209 | ,011 | -245.66918546 | -15.98684754 | ||
| 5,00 | 22.38022495 | 36.201364209 | 1,000 | -92.46094401 | 137.22139391 | ||
| 6,00 | 27.48931605 | 36.201364209 | 1,000 | -87.35185291 | 142.33048501 | ||
| 8,00 | -15.57964100 | 36.201364209 | 1,000 | -130.42080996 | 99.26152796 | ||
| 8,00 | NFS | 47.69083995 | 36.201364209 | ,997 | -67.15032901 | 162.53200891 | |
| NFC | 39.30752705 | 36.201364209 | 1,000 | -75.53364191 | 154.14869601 | ||
| 3,00 | 20.28535150 | 36.201364209 | 1,000 | -94.55581746 | 135.12652046 | ||
| 4,00 | -115.24837550(*) | 36.201364209 | ,048 | -230.08954446 | -.40720654 | ||
| 5,00 | 37.95986595 | 36.201364209 | 1,000 | -76.88130301 | 152.80103491 | ||
| 6,00 | 43.06895705 | 36.201364209 | ,999 | -71.77221191 | 157.91012601 | ||
| 7,00 | 15.57964100 | 36.201364209 | 1,000 | -99.26152796 | 130.42080996 | ||
| * The mean difference is significant at the .05 level. | |||||||
| N | Subset for alpha = .05 | |||
|---|---|---|---|---|
| GROUP | 1 | 2 | ||
| Student-Newman-Keuls(a) | NFS | 20 | 14.53446855 | |
| 6,00 | 20 | 19.15635145 | ||
| NFC | 20 | 22.91778145 | ||
| 5,00 | 20 | 24.26544255 | ||
| 3,00 | 20 | 41.93995700 | ||
| 7,00 | 20 | 46.64566750 | ||
| 8,00 | 20 | 62.22530850 | ||
| 4,00 | 20 | 177.47368400 | ||
| Sig. | ,843 | 1,000 | ||
| Tukey B(a) | NFS | 20 | 14.53446855 | |
| 6,00 | 20 | 19.15635145 | ||
| NFC | 20 | 22.91778145 | ||
| 5,00 | 20 | 24.26544255 | ||
| 3,00 | 20 | 41.93995700 | ||
| 7,00 | 20 | 46.64566750 | ||
| 8,00 | 20 | 62.22530850 | ||
| 4,00 | 20 | 177.47368400 | ||
| Means for groups in homogeneous subsets are displayed. | ||||
| a Uses Harmonic Mean Sample Size = 20,000. | ||||
| Output Created | 06-SEP-2003 16:49:56 | |
|---|---|---|
| Comments | ||
| Input | Data | E:\Brain030905\SOMFinal\results\results06Sep_1635.dat |
| Filter | <none> | |
| Weight | <none> | |
| Split File | <none> | |
| N of Rows in Working Data File | 160 | |
| Missing Value Handling | Definition of Missing | User-defined missing values are treated as missing. |
| Cases Used | Statistics for each analysis are based on cases with no missing data for any variable in the analysis. | |
| Syntax | ONEWAY v4 BY group /STATISTICS DESCRIPTIVES /MISSING ANALYSIS /POSTHOC = SNK TUKEY BTUKEY SCHEFFE LSD BONFERRONI ALPHA(.05). |
|
| Resources | Elapsed Time | 0:00:00,50 |
| N | Mean | Std. Deviation | Std. Error | 95% Confidence Interval for Mean | Minimum | Maximum | ||
|---|---|---|---|---|---|---|---|---|
| Lower Bound | Upper Bound | |||||||
| NFS | 20 | 15.47298890 | 16.166016664 | 3.614831219 | 7.90706021 | 23.03891759 | .250678 | 53.763700 |
| NUS | 20 | 19.09973110 | 60.846332993 | 13.605653675 | -9.37722932 | 47.57669152 | .203727 | 273.695000 |
| RFS | 20 | 44.04897100 | 60.202765814 | 13.461747679 | 15.87320929 | 72.22473271 | .310340 | 235.324000 |
| RUS | 20 | 169.84217005 | 303.894451531 | 67.952865161 | 27.61518870 | 312.06915140 | .368930 | 868.915000 |
| NFC | 20 | 26.27318760 | 23.619053902 | 5.281381009 | 15.21913011 | 37.32724509 | .304292 | 96.440700 |
| NUC | 20 | 25.67758935 | 21.316344910 | 4.766479625 | 15.70123284 | 35.65394586 | .106227 | 73.947200 |
| RFC | 20 | 71.03387900 | 63.217437688 | 14.135848803 | 41.44720743 | 100.62055057 | 4.379710 | 238.724000 |
| RUC | 20 | 73.57695000 | 38.155121242 | 8.531744479 | 55.71980358 | 91.43409642 | 32.356700 | 158.673000 |
| Total | 160 | 55.62818337 | 122.617184284 | 9.693739565 | 36.48308445 | 74.77328230 | .106227 | 868.915000 |
| Sum of Squares | df | Mean Square | F | Sig. | |
|---|---|---|---|---|---|
| Between Groups | 368878,558 | 7 | 52696,937 | 3,962 | ,001 |
| Within Groups | 2021682,289 | 152 | 13300,541 | ||
| Total | 2390560,847 | 159 |
| Mean Difference (I-J) | Std. Error | Sig. | 95% Confidence Interval | ||||
|---|---|---|---|---|---|---|---|
| (I) GROUP | (J) GROUP | Lower Bound | Upper Bound | ||||
| Tukey HSD | NFS | NUS | -3.62674220 | 36.469907285 | 1,000 | -115.72132354 | 108.46783914 |
| RFS | -28.57598210 | 36.469907285 | ,994 | -140.67056344 | 83.51859924 | ||
| RUS | -154.36918115(*) | 36.469907285 | ,001 | -266.46376249 | -42.27459981 | ||
| NFC | -10.80019870 | 36.469907285 | 1,000 | -122.89478004 | 101.29438264 | ||
| NUC | -10.20460045 | 36.469907285 | 1,000 | -122.29918179 | 101.88998089 | ||
| RFC | -55.56089010 | 36.469907285 | ,794 | -167.65547144 | 56.53369124 | ||
| RUC | -58.10396110 | 36.469907285 | ,754 | -170.19854244 | 53.99062024 | ||
| NUS | NFS | 3.62674220 | 36.469907285 | 1,000 | -108.46783914 | 115.72132354 | |
| RFS | -24.94923990 | 36.469907285 | ,997 | -137.04382124 | 87.14534144 | ||
| RUS | -150.74243895(*) | 36.469907285 | ,001 | -262.83702029 | -38.64785761 | ||
| NFC | -7.17345650 | 36.469907285 | 1,000 | -119.26803784 | 104.92112484 | ||
| NUC | -6.57785825 | 36.469907285 | 1,000 | -118.67243959 | 105.51672309 | ||
| RFC | -51.93414790 | 36.469907285 | ,845 | -164.02872924 | 60.16043344 | ||
| RUC | -54.47721890 | 36.469907285 | ,810 | -166.57180024 | 57.61736244 | ||
| RFS | NFS | 28.57598210 | 36.469907285 | ,994 | -83.51859924 | 140.67056344 | |
| NUS | 24.94923990 | 36.469907285 | ,997 | -87.14534144 | 137.04382124 | ||
| RUS | -125.79319905(*) | 36.469907285 | ,016 | -237.88778039 | -13.69861771 | ||
| NFC | 17.77578340 | 36.469907285 | 1,000 | -94.31879794 | 129.87036474 | ||
| NUC | 18.37138165 | 36.469907285 | 1,000 | -93.72319969 | 130.46596299 | ||
| RFC | -26.98490800 | 36.469907285 | ,996 | -139.07948934 | 85.10967334 | ||
| RUC | -29.52797900 | 36.469907285 | ,992 | -141.62256034 | 82.56660234 | ||
| RUS | NFS | 154.36918115(*) | 36.469907285 | ,001 | 42.27459981 | 266.46376249 | |
| NUS | 150.74243895(*) | 36.469907285 | ,001 | 38.64785761 | 262.83702029 | ||
| RFS | 125.79319905(*) | 36.469907285 | ,016 | 13.69861771 | 237.88778039 | ||
| NFC | 143.56898245(*) | 36.469907285 | ,003 | 31.47440111 | 255.66356379 | ||
| NUC | 144.16458070(*) | 36.469907285 | ,003 | 32.06999936 | 256.25916204 | ||
| RFC | 98.80829105 | 36.469907285 | ,128 | -13.28629029 | 210.90287239 | ||
| RUC | 96.26522005 | 36.469907285 | ,150 | -15.82936129 | 208.35980139 | ||
| NFC | NFS | 10.80019870 | 36.469907285 | 1,000 | -101.29438264 | 122.89478004 | |
| NUS | 7.17345650 | 36.469907285 | 1,000 | -104.92112484 | 119.26803784 | ||
| RFS | -17.77578340 | 36.469907285 | 1,000 | -129.87036474 | 94.31879794 | ||
| RUS | -143.56898245(*) | 36.469907285 | ,003 | -255.66356379 | -31.47440111 | ||
| NUC | .59559825 | 36.469907285 | 1,000 | -111.49898309 | 112.69017959 | ||
| RFC | -44.76069140 | 36.469907285 | ,923 | -156.85527274 | 67.33388994 | ||
| RUC | -47.30376240 | 36.469907285 | ,899 | -159.39834374 | 64.79081894 | ||
| NUC | NFS | 10.20460045 | 36.469907285 | 1,000 | -101.88998089 | 122.29918179 | |
| NUS | 6.57785825 | 36.469907285 | 1,000 | -105.51672309 | 118.67243959 | ||
| RFS | -18.37138165 | 36.469907285 | 1,000 | -130.46596299 | 93.72319969 | ||
| RUS | -144.16458070(*) | 36.469907285 | ,003 | -256.25916204 | -32.06999936 | ||
| NFC | -.59559825 | 36.469907285 | 1,000 | -112.69017959 | 111.49898309 | ||
| RFC | -45.35628965 | 36.469907285 | ,917 | -157.45087099 | 66.73829169 | ||
| RUC | -47.89936065 | 36.469907285 | ,893 | -159.99394199 | 64.19522069 | ||
| RFC | NFS | 55.56089010 | 36.469907285 | ,794 | -56.53369124 | 167.65547144 | |
| NUS | 51.93414790 | 36.469907285 | ,845 | -60.16043344 | 164.02872924 | ||
| RFS | 26.98490800 | 36.469907285 | ,996 | -85.10967334 | 139.07948934 | ||
| RUS | -98.80829105 | 36.469907285 | ,128 | -210.90287239 | 13.28629029 | ||
| NFC | 44.76069140 | 36.469907285 | ,923 | -67.33388994 | 156.85527274 | ||
| NUC | 45.35628965 | 36.469907285 | ,917 | -66.73829169 | 157.45087099 | ||
| RUC | -2.54307100 | 36.469907285 | 1,000 | -114.63765234 | 109.55151034 | ||
| RUC | NFS | 58.10396110 | 36.469907285 | ,754 | -53.99062024 | 170.19854244 | |
| NUS | 54.47721890 | 36.469907285 | ,810 | -57.61736244 | 166.57180024 | ||
| RFS | 29.52797900 | 36.469907285 | ,992 | -82.56660234 | 141.62256034 | ||
| RUS | -96.26522005 | 36.469907285 | ,150 | -208.35980139 | 15.82936129 | ||
| NFC | 47.30376240 | 36.469907285 | ,899 | -64.79081894 | 159.39834374 | ||
| NUC | 47.89936065 | 36.469907285 | ,893 | -64.19522069 | 159.99394199 | ||
| RFC | 2.54307100 | 36.469907285 | 1,000 | -109.55151034 | 114.63765234 | ||
| Scheffe | NFS | NUS | -3.62674220 | 36.469907285 | 1,000 | -142.46253313 | 135.20904873 |
| RFS | -28.57598210 | 36.469907285 | ,999 | -167.41177303 | 110.25980883 | ||
| RUS | -154.36918115(*) | 36.469907285 | ,016 | -293.20497208 | -15.53339022 | ||
| NFC | -10.80019870 | 36.469907285 | 1,000 | -149.63598963 | 128.03559223 | ||
| NUC | -10.20460045 | 36.469907285 | 1,000 | -149.04039138 | 128.63119048 | ||
| RFC | -55.56089010 | 36.469907285 | ,939 | -194.39668103 | 83.27490083 | ||
| RUC | -58.10396110 | 36.469907285 | ,923 | -196.93975203 | 80.73182983 | ||
| NUS | NFS | 3.62674220 | 36.469907285 | 1,000 | -135.20904873 | 142.46253313 | |
| RFS | -24.94923990 | 36.469907285 | 1,000 | -163.78503083 | 113.88655103 | ||
| RUS | -150.74243895(*) | 36.469907285 | ,021 | -289.57822988 | -11.90664802 | ||
| NFC | -7.17345650 | 36.469907285 | 1,000 | -146.00924743 | 131.66233443 | ||
| NUC | -6.57785825 | 36.469907285 | 1,000 | -145.41364918 | 132.25793268 | ||
| RFC | -51.93414790 | 36.469907285 | ,957 | -190.76993883 | 86.90164303 | ||
| RUC | -54.47721890 | 36.469907285 | ,945 | -193.31300983 | 84.35857203 | ||
| RFS | NFS | 28.57598210 | 36.469907285 | ,999 | -110.25980883 | 167.41177303 | |
| NUS | 24.94923990 | 36.469907285 | 1,000 | -113.88655103 | 163.78503083 | ||
| RUS | -125.79319905 | 36.469907285 | ,113 | -264.62898998 | 13.04259188 | ||
| NFC | 17.77578340 | 36.469907285 | 1,000 | -121.06000753 | 156.61157433 | ||
| NUC | 18.37138165 | 36.469907285 | 1,000 | -120.46440928 | 157.20717258 | ||
| RFC | -26.98490800 | 36.469907285 | ,999 | -165.82069893 | 111.85088293 | ||
| RUC | -29.52797900 | 36.469907285 | ,999 | -168.36376993 | 109.30781193 | ||
| RUS | NFS | 154.36918115(*) | 36.469907285 | ,016 | 15.53339022 | 293.20497208 | |
| NUS | 150.74243895(*) | 36.469907285 | ,021 | 11.90664802 | 289.57822988 | ||
| RFS | 125.79319905 | 36.469907285 | ,113 | -13.04259188 | 264.62898998 | ||
| NFC | 143.56898245(*) | 36.469907285 | ,036 | 4.73319152 | 282.40477338 | ||
| NUC | 144.16458070(*) | 36.469907285 | ,035 | 5.32878977 | 283.00037163 | ||
| RFC | 98.80829105 | 36.469907285 | ,400 | -40.02749988 | 237.64408198 | ||
| RUC | 96.26522005 | 36.469907285 | ,437 | -42.57057088 | 235.10101098 | ||
| NFC | NFS | 10.80019870 | 36.469907285 | 1,000 | -128.03559223 | 149.63598963 | |
| NUS | 7.17345650 | 36.469907285 | 1,000 | -131.66233443 | 146.00924743 | ||
| RFS | -17.77578340 | 36.469907285 | 1,000 | -156.61157433 | 121.06000753 | ||
| RUS | -143.56898245(*) | 36.469907285 | ,036 | -282.40477338 | -4.73319152 | ||
| NUC | .59559825 | 36.469907285 | 1,000 | -138.24019268 | 139.43138918 | ||
| RFC | -44.76069140 | 36.469907285 | ,981 | -183.59648233 | 94.07509953 | ||
| RUC | -47.30376240 | 36.469907285 | ,975 | -186.13955333 | 91.53202853 | ||
| NUC | NFS | 10.20460045 | 36.469907285 | 1,000 | -128.63119048 | 149.04039138 | |
| NUS | 6.57785825 | 36.469907285 | 1,000 | -132.25793268 | 145.41364918 | ||
| RFS | -18.37138165 | 36.469907285 | 1,000 | -157.20717258 | 120.46440928 | ||
| RUS | -144.16458070(*) | 36.469907285 | ,035 | -283.00037163 | -5.32878977 | ||
| NFC | -.59559825 | 36.469907285 | 1,000 | -139.43138918 | 138.24019268 | ||
| RFC | -45.35628965 | 36.469907285 | ,980 | -184.19208058 | 93.47950128 | ||
| RUC | -47.89936065 | 36.469907285 | ,973 | -186.73515158 | 90.93643028 | ||
| RFC | NFS | 55.56089010 | 36.469907285 | ,939 | -83.27490083 | 194.39668103 | |
| NUS | 51.93414790 | 36.469907285 | ,957 | -86.90164303 | 190.76993883 | ||
| RFS | 26.98490800 | 36.469907285 | ,999 | -111.85088293 | 165.82069893 | ||
| RUS | -98.80829105 | 36.469907285 | ,400 | -237.64408198 | 40.02749988 | ||
| NFC | 44.76069140 | 36.469907285 | ,981 | -94.07509953 | 183.59648233 | ||
| NUC | 45.35628965 | 36.469907285 | ,980 | -93.47950128 | 184.19208058 | ||
| RUC | -2.54307100 | 36.469907285 | 1,000 | -141.37886193 | 136.29271993 | ||
| RUC | NFS | 58.10396110 | 36.469907285 | ,923 | -80.73182983 | 196.93975203 | |
| NUS | 54.47721890 | 36.469907285 | ,945 | -84.35857203 | 193.31300983 | ||
| RFS | 29.52797900 | 36.469907285 | ,999 | -109.30781193 | 168.36376993 | ||
| RUS | -96.26522005 | 36.469907285 | ,437 | -235.10101098 | 42.57057088 | ||
| NFC | 47.30376240 | 36.469907285 | ,975 | -91.53202853 | 186.13955333 | ||
| NUC | 47.89936065 | 36.469907285 | ,973 | -90.93643028 | 186.73515158 | ||
| RFC | 2.54307100 | 36.469907285 | 1,000 | -136.29271993 | 141.37886193 | ||
| LSD | NFS | NUS | -3.62674220 | 36.469907285 | ,921 | -75.68011657 | 68.42663217 |
| RFS | -28.57598210 | 36.469907285 | ,435 | -100.62935647 | 43.47739227 | ||
| RUS | -154.36918115(*) | 36.469907285 | ,000 | -226.42255552 | -82.31580678 | ||
| NFC | -10.80019870 | 36.469907285 | ,768 | -82.85357307 | 61.25317567 | ||
| NUC | -10.20460045 | 36.469907285 | ,780 | -82.25797482 | 61.84877392 | ||
| RFC | -55.56089010 | 36.469907285 | ,130 | -127.61426447 | 16.49248427 | ||
| RUC | -58.10396110 | 36.469907285 | ,113 | -130.15733547 | 13.94941327 | ||
| NUS | NFS | 3.62674220 | 36.469907285 | ,921 | -68.42663217 | 75.68011657 | |
| RFS | -24.94923990 | 36.469907285 | ,495 | -97.00261427 | 47.10413447 | ||
| RUS | -150.74243895(*) | 36.469907285 | ,000 | -222.79581332 | -78.68906458 | ||
| NFC | -7.17345650 | 36.469907285 | ,844 | -79.22683087 | 64.87991787 | ||
| NUC | -6.57785825 | 36.469907285 | ,857 | -78.63123262 | 65.47551612 | ||
| RFC | -51.93414790 | 36.469907285 | ,156 | -123.98752227 | 20.11922647 | ||
| RUC | -54.47721890 | 36.469907285 | ,137 | -126.53059327 | 17.57615547 | ||
| RFS | NFS | 28.57598210 | 36.469907285 | ,435 | -43.47739227 | 100.62935647 | |
| NUS | 24.94923990 | 36.469907285 | ,495 | -47.10413447 | 97.00261427 | ||
| RUS | -125.79319905(*) | 36.469907285 | ,001 | -197.84657342 | -53.73982468 | ||
| NFC | 17.77578340 | 36.469907285 | ,627 | -54.27759097 | 89.82915777 | ||
| NUC | 18.37138165 | 36.469907285 | ,615 | -53.68199272 | 90.42475602 | ||
| RFC | -26.98490800 | 36.469907285 | ,460 | -99.03828237 | 45.06846637 | ||
| RUC | -29.52797900 | 36.469907285 | ,419 | -101.58135337 | 42.52539537 | ||
| RUS | NFS | 154.36918115(*) | 36.469907285 | ,000 | 82.31580678 | 226.42255552 | |
| NUS | 150.74243895(*) | 36.469907285 | ,000 | 78.68906458 | 222.79581332 | ||
| RFS | 125.79319905(*) | 36.469907285 | ,001 | 53.73982468 | 197.84657342 | ||
| NFC | 143.56898245(*) | 36.469907285 | ,000 | 71.51560808 | 215.62235682 | ||
| NUC | 144.16458070(*) | 36.469907285 | ,000 | 72.11120633 | 216.21795507 | ||
| RFC | 98.80829105(*) | 36.469907285 | ,008 | 26.75491668 | 170.86166542 | ||
| RUC | 96.26522005(*) | 36.469907285 | ,009 | 24.21184568 | 168.31859442 | ||
| NFC | NFS | 10.80019870 | 36.469907285 | ,768 | -61.25317567 | 82.85357307 | |
| NUS | 7.17345650 | 36.469907285 | ,844 | -64.87991787 | 79.22683087 | ||
| RFS | -17.77578340 | 36.469907285 | ,627 | -89.82915777 | 54.27759097 | ||
| RUS | -143.56898245(*) | 36.469907285 | ,000 | -215.62235682 | -71.51560808 | ||
| NUC | .59559825 | 36.469907285 | ,987 | -71.45777612 | 72.64897262 | ||
| RFC | -44.76069140 | 36.469907285 | ,222 | -116.81406577 | 27.29268297 | ||
| RUC | -47.30376240 | 36.469907285 | ,197 | -119.35713677 | 24.74961197 | ||
| NUC | NFS | 10.20460045 | 36.469907285 | ,780 | -61.84877392 | 82.25797482 | |
| NUS | 6.57785825 | 36.469907285 | ,857 | -65.47551612 | 78.63123262 | ||
| RFS | -18.37138165 | 36.469907285 | ,615 | -90.42475602 | 53.68199272 | ||
| RUS | -144.16458070(*) | 36.469907285 | ,000 | -216.21795507 | -72.11120633 | ||
| NFC | -.59559825 | 36.469907285 | ,987 | -72.64897262 | 71.45777612 | ||
| RFC | -45.35628965 | 36.469907285 | ,216 | -117.40966402 | 26.69708472 | ||
| RUC | -47.89936065 | 36.469907285 | ,191 | -119.95273502 | 24.15401372 | ||
| RFC | NFS | 55.56089010 | 36.469907285 | ,130 | -16.49248427 | 127.61426447 | |
| NUS | 51.93414790 | 36.469907285 | ,156 | -20.11922647 | 123.98752227 | ||
| RFS | 26.98490800 | 36.469907285 | ,460 | -45.06846637 | 99.03828237 | ||
| RUS | -98.80829105(*) | 36.469907285 | ,008 | -170.86166542 | -26.75491668 | ||
| NFC | 44.76069140 | 36.469907285 | ,222 | -27.29268297 | 116.81406577 | ||
| NUC | 45.35628965 | 36.469907285 | ,216 | -26.69708472 | 117.40966402 | ||
| RUC | -2.54307100 | 36.469907285 | ,944 | -74.59644537 | 69.51030337 | ||
| RUC | NFS | 58.10396110 | 36.469907285 | ,113 | -13.94941327 | 130.15733547 | |
| NUS | 54.47721890 | 36.469907285 | ,137 | -17.57615547 | 126.53059327 | ||
| RFS | 29.52797900 | 36.469907285 | ,419 | -42.52539537 | 101.58135337 | ||
| RUS | -96.26522005(*) | 36.469907285 | ,009 | -168.31859442 | -24.21184568 | ||
| NFC | 47.30376240 | 36.469907285 | ,197 | -24.74961197 | 119.35713677 | ||
| NUC | 47.89936065 | 36.469907285 | ,191 | -24.15401372 | 119.95273502 | ||
| RFC | 2.54307100 | 36.469907285 | ,944 | -69.51030337 | 74.59644537 | ||
| Bonferroni | NFS | NUS | -3.62674220 | 36.469907285 | 1,000 | -119.59778197 | 112.34429757 |
| RFS | -28.57598210 | 36.469907285 | 1,000 | -144.54702187 | 87.39505767 | ||
| RUS | -154.36918115(*) | 36.469907285 | ,001 | -270.34022092 | -38.39814138 | ||
| NFC | -10.80019870 | 36.469907285 | 1,000 | -126.77123847 | 105.17084107 | ||
| NUC | -10.20460045 | 36.469907285 | 1,000 | -126.17564022 | 105.76643932 | ||
| RFC | -55.56089010 | 36.469907285 | 1,000 | -171.53192987 | 60.41014967 | ||
| RUC | -58.10396110 | 36.469907285 | 1,000 | -174.07500087 | 57.86707867 | ||
| NUS | NFS | 3.62674220 | 36.469907285 | 1,000 | -112.34429757 | 119.59778197 | |
| RFS | -24.94923990 | 36.469907285 | 1,000 | -140.92027967 | 91.02179987 | ||
| RUS | -150.74243895(*) | 36.469907285 | ,002 | -266.71347872 | -34.77139918 | ||
| NFC | -7.17345650 | 36.469907285 | 1,000 | -123.14449627 | 108.79758327 | ||
| NUC | -6.57785825 | 36.469907285 | 1,000 | -122.54889802 | 109.39318152 | ||
| RFC | -51.93414790 | 36.469907285 | 1,000 | -167.90518767 | 64.03689187 | ||
| RUC | -54.47721890 | 36.469907285 | 1,000 | -170.44825867 | 61.49382087 | ||
| RFS | NFS | 28.57598210 | 36.469907285 | 1,000 | -87.39505767 | 144.54702187 | |
| NUS | 24.94923990 | 36.469907285 | 1,000 | -91.02179987 | 140.92027967 | ||
| RUS | -125.79319905(*) | 36.469907285 | ,020 | -241.76423882 | -9.82215928 | ||
| NFC | 17.77578340 | 36.469907285 | 1,000 | -98.19525637 | 133.74682317 | ||
| NUC | 18.37138165 | 36.469907285 | 1,000 | -97.59965812 | 134.34242142 | ||
| RFC | -26.98490800 | 36.469907285 | 1,000 | -142.95594777 | 88.98613177 | ||
| RUC | -29.52797900 | 36.469907285 | 1,000 | -145.49901877 | 86.44306077 | ||
| RUS | NFS | 154.36918115(*) | 36.469907285 | ,001 | 38.39814138 | 270.34022092 | |
| NUS | 150.74243895(*) | 36.469907285 | ,002 | 34.77139918 | 266.71347872 | ||
| RFS | 125.79319905(*) | 36.469907285 | ,020 | 9.82215928 | 241.76423882 | ||
| NFC | 143.56898245(*) | 36.469907285 | ,004 | 27.59794268 | 259.54002222 | ||
| NUC | 144.16458070(*) | 36.469907285 | ,003 | 28.19354093 | 260.13562047 | ||
| RFC | 98.80829105 | 36.469907285 | ,210 | -17.16274872 | 214.77933082 | ||
| RUC | 96.26522005 | 36.469907285 | ,257 | -19.70581972 | 212.23625982 | ||
| NFC | NFS | 10.80019870 | 36.469907285 | 1,000 | -105.17084107 | 126.77123847 | |
| NUS | 7.17345650 | 36.469907285 | 1,000 | -108.79758327 | 123.14449627 | ||
| RFS | -17.77578340 | 36.469907285 | 1,000 | -133.74682317 | 98.19525637 | ||
| RUS | -143.56898245(*) | 36.469907285 | ,004 | -259.54002222 | -27.59794268 | ||
| NUC | .59559825 | 36.469907285 | 1,000 | -115.37544152 | 116.56663802 | ||
| RFC | -44.76069140 | 36.469907285 | 1,000 | -160.73173117 | 71.21034837 | ||
| RUC | -47.30376240 | 36.469907285 | 1,000 | -163.27480217 | 68.66727737 | ||
| NUC | NFS | 10.20460045 | 36.469907285 | 1,000 | -105.76643932 | 126.17564022 | |
| NUS | 6.57785825 | 36.469907285 | 1,000 | -109.39318152 | 122.54889802 | ||
| RFS | -18.37138165 | 36.469907285 | 1,000 | -134.34242142 | 97.59965812 | ||
| RUS | -144.16458070(*) | 36.469907285 | ,003 | -260.13562047 | -28.19354093 | ||
| NFC | -.59559825 | 36.469907285 | 1,000 | -116.56663802 | 115.37544152 | ||
| RFC | -45.35628965 | 36.469907285 | 1,000 | -161.32732942 | 70.61475012 | ||
| RUC | -47.89936065 | 36.469907285 | 1,000 | -163.87040042 | 68.07167912 | ||
| RFC | NFS | 55.56089010 | 36.469907285 | 1,000 | -60.41014967 | 171.53192987 | |
| NUS | 51.93414790 | 36.469907285 | 1,000 | -64.03689187 | 167.90518767 | ||
| RFS | 26.98490800 | 36.469907285 | 1,000 | -88.98613177 | 142.95594777 | ||
| RUS | -98.80829105 | 36.469907285 | ,210 | -214.77933082 | 17.16274872 | ||
| NFC | 44.76069140 | 36.469907285 | 1,000 | -71.21034837 | 160.73173117 | ||
| NUC | 45.35628965 | 36.469907285 | 1,000 | -70.61475012 | 161.32732942 | ||
| RUC | -2.54307100 | 36.469907285 | 1,000 | -118.51411077 | 113.42796877 | ||
| RUC | NFS | 58.10396110 | 36.469907285 | 1,000 | -57.86707867 | 174.07500087 | |
| NUS | 54.47721890 | 36.469907285 | 1,000 | -61.49382087 | 170.44825867 | ||
| RFS | 29.52797900 | 36.469907285 | 1,000 | -86.44306077 | 145.49901877 | ||
| RUS | -96.26522005 | 36.469907285 | ,257 | -212.23625982 | 19.70581972 | ||
| NFC | 47.30376240 | 36.469907285 | 1,000 | -68.66727737 | 163.27480217 | ||
| NUC | 47.89936065 | 36.469907285 | 1,000 | -68.07167912 | 163.87040042 | ||
| RFC | 2.54307100 | 36.469907285 | 1,000 | -113.42796877 | 118.51411077 | ||
| * The mean difference is significant at the .05 level. | |||||||
| N | Subset for alpha = .05 | |||
|---|---|---|---|---|
| GROUP | 1 | 2 | ||
| Student-Newman-Keuls(a) | NFS | 20 | 15.47298890 | |
| NUS | 20 | 19.09973110 | ||
| NUC | 20 | 25.67758935 | ||
| NFC | 20 | 26.27318760 | ||
| RFS | 20 | 44.04897100 | ||
| RFC | 20 | 71.03387900 | ||
| RUC | 20 | 73.57695000 | ||
| RUS | 20 | 169.84217005 | ||
| Sig. | ,687 | 1,000 | ||
| Tukey HSD(a) | NFS | 20 | 15.47298890 | |
| NUS | 20 | 19.09973110 | ||
| NUC | 20 | 25.67758935 | ||
| NFC | 20 | 26.27318760 | ||
| RFS | 20 | 44.04897100 | ||
| RFC | 20 | 71.03387900 | 71.03387900 | |
| RUC | 20 | 73.57695000 | 73.57695000 | |
| RUS | 20 | 169.84217005 | ||
| Sig. | ,754 | ,128 | ||
| Tukey B(a) | NFS | 20 | 15.47298890 | |
| NUS | 20 | 19.09973110 | ||
| NUC | 20 | 25.67758935 | ||
| NFC | 20 | 26.27318760 | ||
| RFS | 20 | 44.04897100 | ||
| RFC | 20 | 71.03387900 | 71.03387900 | |
| RUC | 20 | 73.57695000 | 73.57695000 | |
| RUS | 20 | 169.84217005 | ||
| Scheffe(a) | NFS | 20 | 15.47298890 | |
| NUS | 20 | 19.09973110 | ||
| NUC | 20 | 25.67758935 | ||
| NFC | 20 | 26.27318760 | ||
| RFS | 20 | 44.04897100 | 44.04897100 | |
| RFC | 20 | 71.03387900 | 71.03387900 | |
| RUC | 20 | 73.57695000 | 73.57695000 | |
| RUS | 20 | 169.84217005 | ||
| Sig. | ,923 | ,113 | ||
| Means for groups in homogeneous subsets are displayed. | ||||
| a Uses Harmonic Mean Sample Size = 20,000. | ||||